
Can Ethereum price rally continue above $2100 as BlackRock’s staked Ethereum ETF launches?
Ethereum’s price rallied to a weekly high of $2,144 on Friday following the strong debut of investment manager BlackRock’s staked Ethereum ETF.
Summary
- Ethereum price broke past the $2,100 resistance level on March 13.
- BlackRock’s staking ETF ETHB pulled in $15.5 million in trading volume on launch day.
- A bullish SMA crossover is close to confirmation on the daily chart.
According to data from crypto.news, Ethereum (ETH) price shot up nearly 6% to $2,144 during Friday morning Asian time before stabilizing around $2,100 at the time of writing. At this valuation, the second-largest crypto asset by market cap sits 11% above its weekly low and over 18% from its lowest point in February.
The rally gained momentum after BlackRock recorded a very strong debut with its iShares Staked Ethereum ETF (ETHB) on Nasdaq. The first Ethereum ETF from the world’s largest asset manager to include staking pulled in around $15.5 million in trading volume on its first day.
For context, the iShares Staked Ethereum Trust (ETHB) operates by holding spot Ethereum and dynamically staking between 70% and 95% of its reserves directly on the Ethereum network. This structure allows investors to receive 82% of staking rewards through monthly distributions. This largely differs from existing Ethereum ETFs, where investors forego staking rewards, making those older products much less appealing.
As such, there is a strong possibility that investors could begin rotating their capital from other ETH ETFs, including BlackRock’s own ETHA, which offers no staking, into the new ETHB.
Investors who have previously stayed on the sidelines due to the lack of yield could now also enter the market while enjoying the added benefits of staking rewards. This shift, driven by those who finally see the ETF as a productive asset, could likely act as a fresh catalyst to sustain the current uptrend.
Meanwhile, besides the ETF news, a sharp drop in crude oil prices provided extra tailwinds. Brent crude dropped 7% today, renewing investor demand for risk assets, including Ethereum, as they rotate away from traditional safe-haven assets.
On the daily chart, technical indicators seem to suggest that Ethereum’s price could sustain its rally above $2,100 in the short term.
Notably, the 20-day moving average appears to be close to confirming a bullish crossover with the 50-day moving average. Meanwhile, the Aroon Up remains at 35.71%, which is comfortably above the Aroon Down at 7.14%. Ethereum’s RSI has also yet to enter the overbought area.
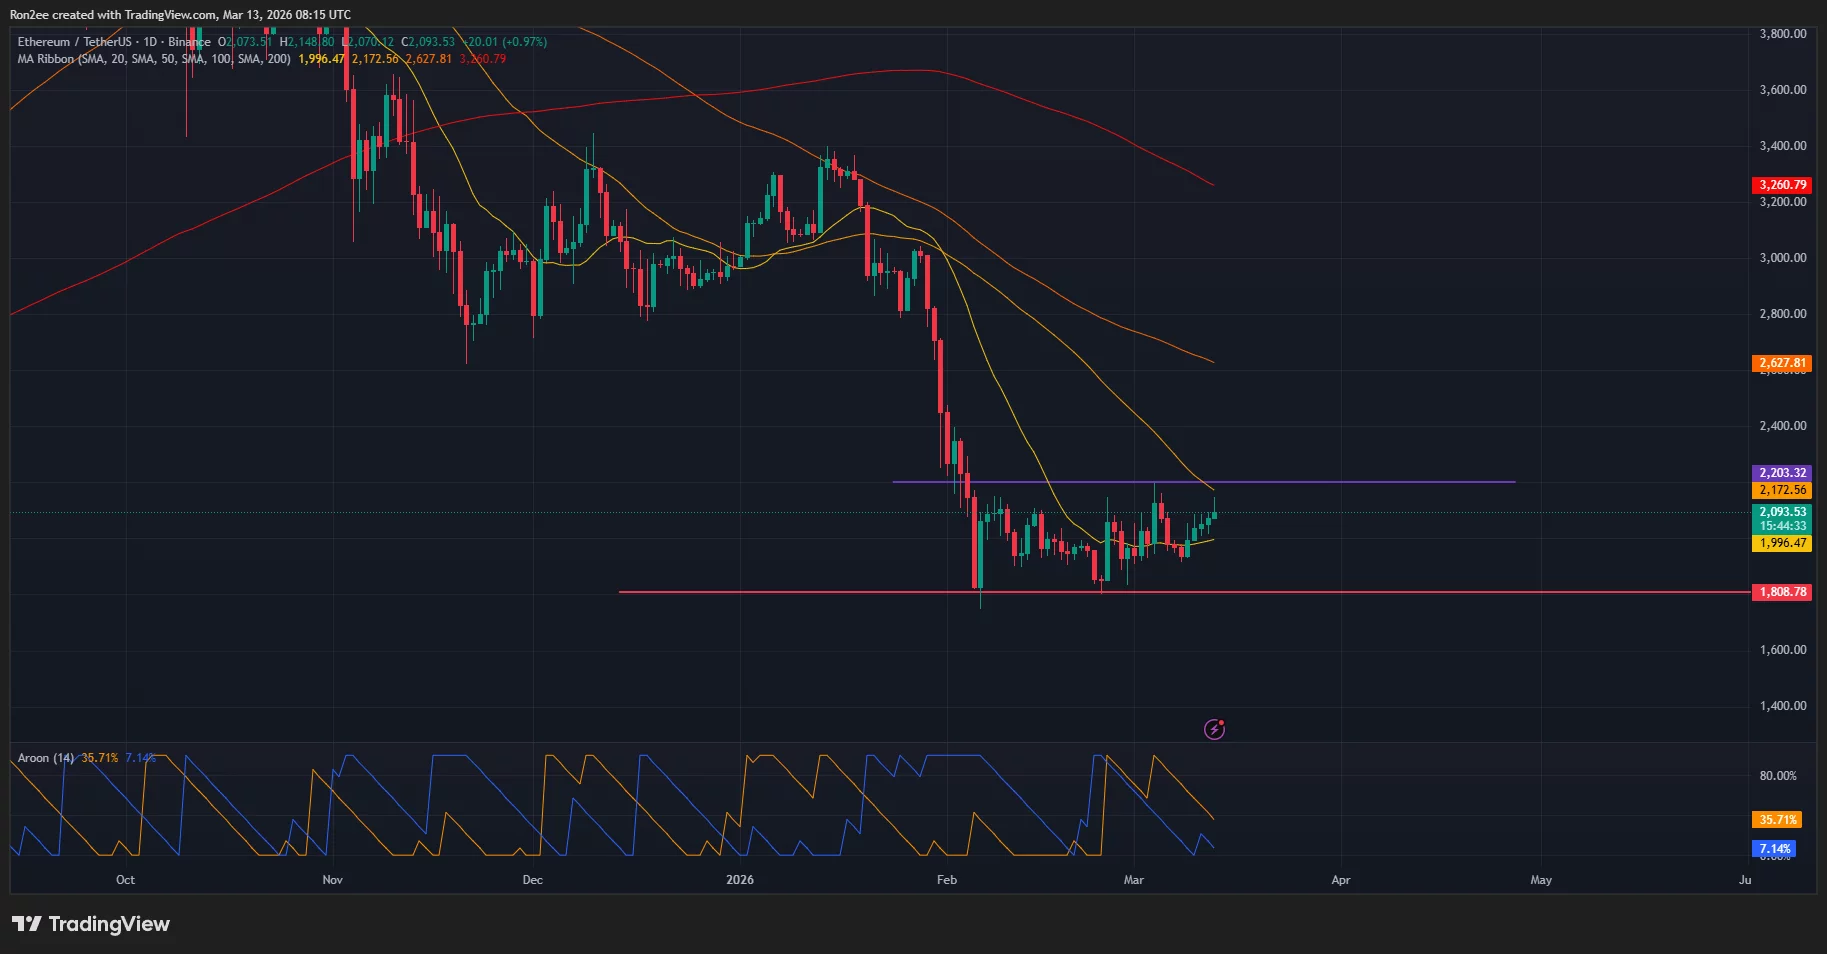
This suggests there is still room for the uptrend to continue before any potential exhaustion or reversal occurs.
For now, $2,200 could act as the immediate resistance that traders will be watching closely for signs of a breakout. A move above that level could act as a definitive confirmation of a positive shift in market sentiment.
A rally above that mark would also invalidate a major bearish pattern. As previously reported by analysts at crypto.news, the price has been forming a bearish flag pattern over multiple months.
Bearish flag patterns are considered some of the most bearish formations in technical analysis. If ETH falls towards $1800, it would confirm the pattern.