

Bitcoin cycle data points to $40K-$46K bottom, Galaxy says
Bitcoin may not have formed its cycle bottom yet, according to a new Galaxy Research report that uses market and onchain data to map possible downside zones.
Summary
- Galaxy says Bitcoin’s four-year cycle remains active, but each cycle is showing smaller price swings.
- The report places Bitcoin’s base-case bottom between $40,000 and $46,000 using onchain cycle data.
- Only four of 13 bottom indicators have triggered, suggesting Bitcoin may need more time.
Galaxy Head of Firmwide Research Alex Thorn said Bitcoin’s four-year cycle still appears active, even as the size of each move continues to shrink. The report argues that Bitcoin’s cycle structure has not disappeared, but its highs and lows have become less extreme.
“The 4-year cycle is still real, but it’s compressing,” said Galaxy Head of Firmwide Research Alex Thorn.
The report tracks Bitcoin’s path from prior lows through halvings, cycle tops, and later bottoms. Galaxy said earlier cycles saw peak-to-trough declines of 85%, 84%, and 77%, while the current drawdown has reached about 51% so far.
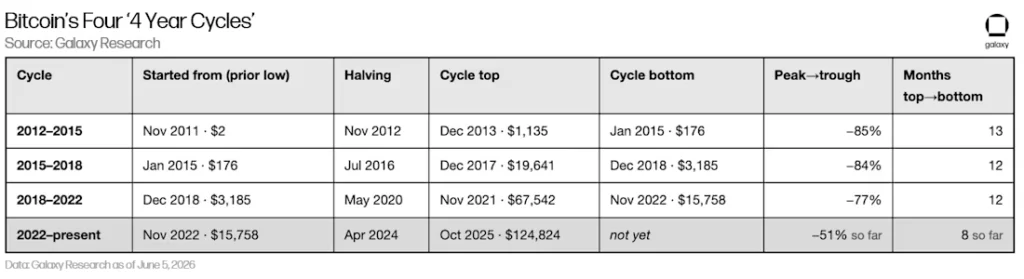
The current cycle is only about eight months past the October 2025 top. Galaxy said past bear-market lows have usually arrived 12 to 13 months after a cycle peak, placing the historical window closer to late 2026.
Bitcoin calm top changes bottom math
Galaxy said the October 2025 Bitcoin top was the calmest on record by several onchain measures. Only two of 11 classic top signals triggered, and both did so only slightly.
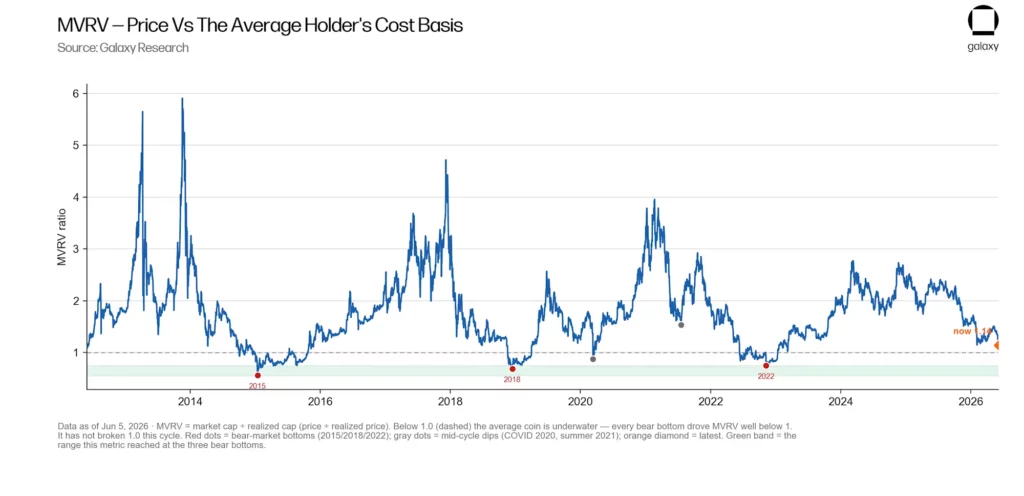
The report said Bitcoin’s MVRV ratio peaked at 2.29 in the current cycle. That compares with prior cycle tops between 2.93 and 5.91, showing less crowd euphoria at the peak.
The Pi Cycle Top signal also did not trigger during the October 2025 high. Galaxy said that was the first time the signal failed to appear during a major Bitcoin cycle top.
The calmer top matters because it placed Bitcoin’s market cost basis closer to the cycle high. Galaxy said the cost basis sat at about 43.7% of the prior all-time high, higher than in earlier cycles.
Galaxy maps Bitcoin bottom ranges
Galaxy’s base-case model places a possible Bitcoin bottom between $40,000 and $46,000. That range assumes the current cycle follows the trend of bottoms rising closer to fair value.
A harsher washout, similar to prior deep bear markets, could place the bottom between $30,000 and $37,000. A shallower outcome could hold between $51,000 and $54,000 if steady demand absorbs the decline.
“Overall, our data analysis suggests a Q4 2026 BTCUSD bottom,” said Thorn.
The report rejects the older rule that Bitcoin must fall 75% to 85% from its cycle high. Galaxy said that approach may now be outdated because it does not account for the calmer top and higher cost basis.
At press time, Bitcoin traded near $63,437 on June 12, according to crypto.news market data. That leaves spot price above Galaxy’s base-case bottom zone, but near the four-year average area that the report tracks as a key long-term support marker.
Bottom signals remain incomplete
Galaxy said only four of 13 bottom indicators have triggered during the current drawdown. The report said the strongest historical signs of a true bottom have not appeared yet.
Those missing signals include Bitcoin trading below its cost basis, holders sitting on broad unrealized losses, sustained loss-taking, and a deeper capitulation flush. Past cycle bottoms showed more of these conditions at once.
Galaxy also noted that Bitcoin had not fallen below its cost basis in this cycle. The current MVRV low has stayed near 1.14, while past bottoms pushed the ratio below 1.0.
The report also warned that the cost basis can move lower during panic selling. If coins change hands at losses, the realized price can fall and pull the estimated bottom range down.
ETF flows and market stress still matter
Galaxy’s study does not include political, regulatory, or geopolitical events in its model. It focuses on price history, timing, valuation, miner stress, trend measures, and sentiment data.
That matters because Bitcoin is also moving through a weak macro backdrop. As previously reported by crypto.news, the June crypto crash came from several pressures, including ETF outflows, U.S.-Iran tensions, a hawkish Fed, and leverage liquidations.
As previously reported, SpaceX IPO demand and broader capital rotation also thinned crypto liquidity before the selloff. That made Bitcoin more sensitive to forced selling when market pressure increased.
Bitcoin recently rebounded near $63.4K as Iran deal hopes cooled risk-off pressure, as reported earlier today. ETF outflows and options positioning still kept the $60K support area in focus.
Disclosure: This article does not represent investment advice. The content and materials featured on this page are for educational purposes only.