

Can Hyperliquid price rally to $50 as it forms a rising wedge?
Hyperliquid rose over 10% this week, reclaiming the $40 support level amid a surge in commodities futures trading on the platform.
Summary
- Hyperliquid price rose over 10% this week, reclaiming $40 support as commodities perpetuals trading surged, with oil volume hitting $1.2 billion in a day.
- Whale accumulation neared $200 million over 30 days, while ETF-related developments from Bitwise and Grayscale point to growing institutional interest.
- Rising wedge pattern signals potential move toward $50 if momentum holds, though a break below $40 could trigger a drop toward $35.
According to data from crypto.news, Hyperliquid (HYPE) price rose from a $39 low on Wednesday last week to an intraday high of $43 before stabilizing at $42 and establishing $40 as a firm support floor.
The Hyperliquid price rally was fueled by record-breaking volumes in crude oil and silver perpetuals under its HIP-3 framework, with oil alone hitting $1.2 billion in trading volume in a single day.
Its gains were also supported by high-profile ETF filings from Bitwise and updates to Grayscale’s HYPE ETF filing. Such developments suggest institutional investors are eyeing the asset for long-term growth and broader market integration.
On-chain data show that whales have been accumulating the token aggressively. These major holders have purchased nearly $200 million worth of HYPE over the last 30 days. Such a strong accumulation trend from whales suggests these deep-pocketed investors likely see massive upside potential for the token in the coming weeks.
Hyperliquid currently generates roughly $1.7 million in revenue every day, more than double its closest rivals. Its tokenomics show that up to 97% of these fees are used to buy back HYPE from the open market, which helps to maintain constant upward pressure for the token through a consistent buyback engine.
Hyperliquid price analysis
On the daily chart, Hyperliquid has been forming a rising wedge formed of two ascending and converging trendlines. As long as an asset’s price remains within the pattern, it forms a series of higher highs and higher lows and tends to move higher.
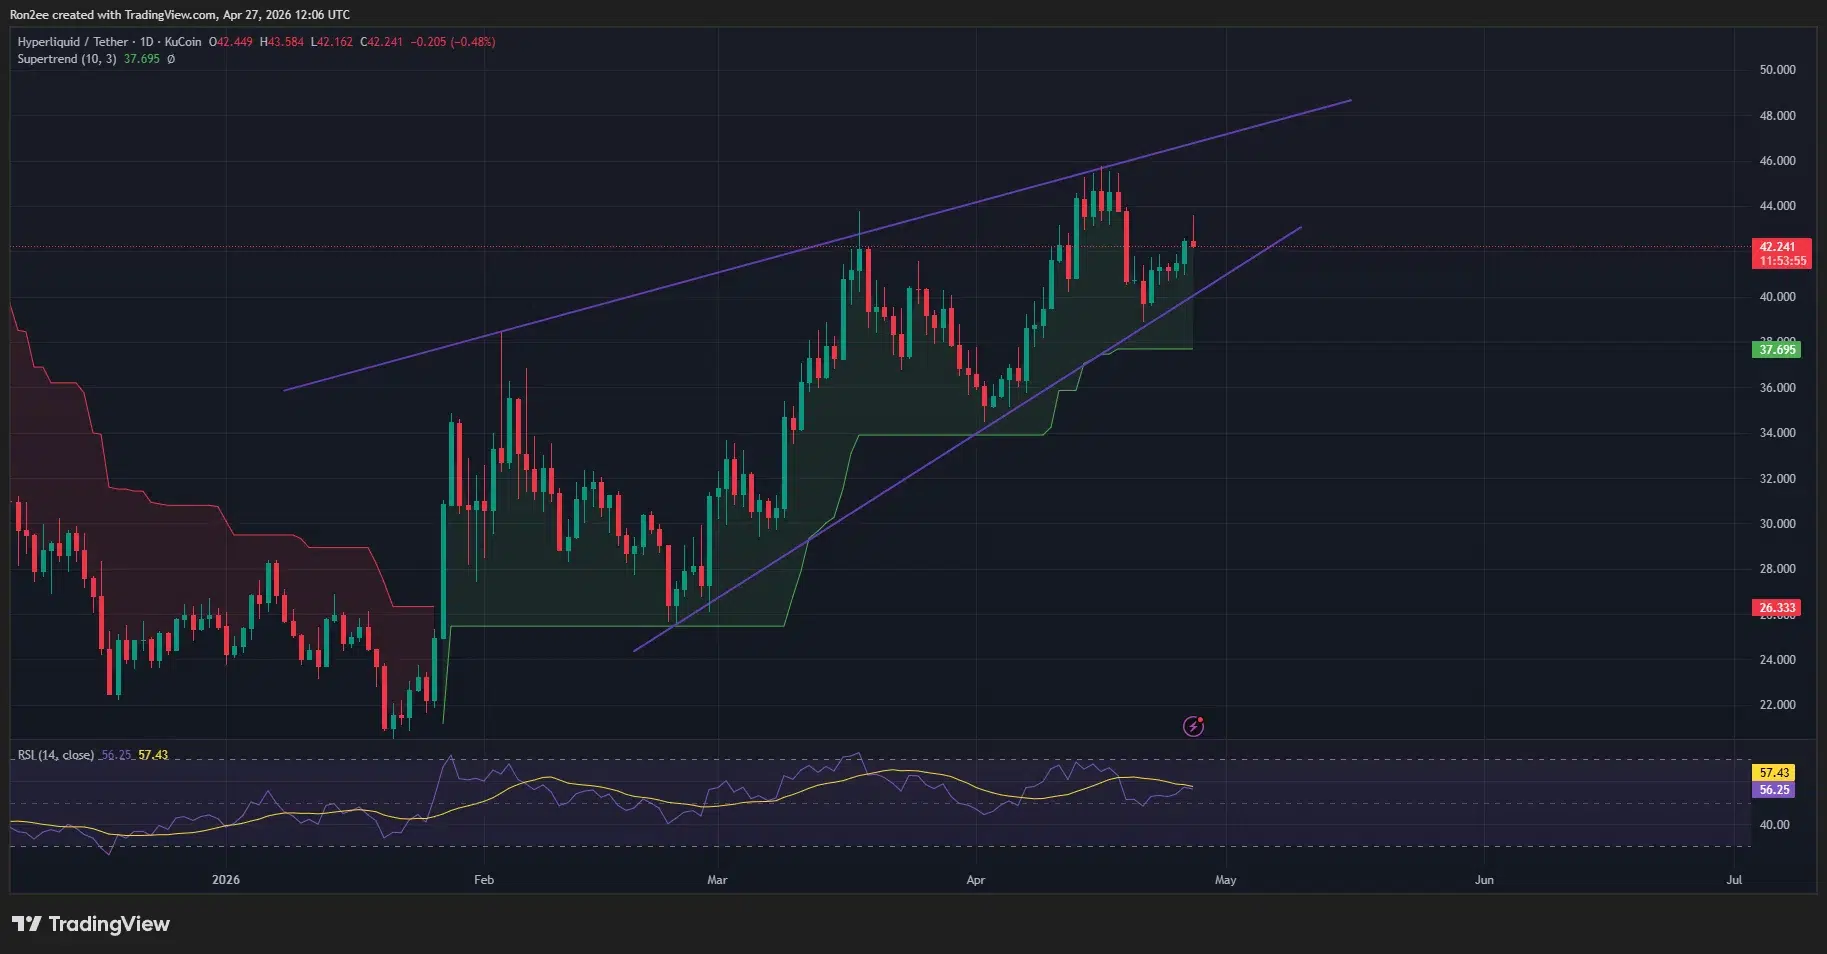
However, a breakdown below such a pattern typically indicates a bearish reversal, as the narrowing range suggests that buying pressure is finally starting to exhaust.
The Supertrend has remained green since the beginning of the recent rally, suggesting that the overall market bias is still firmly in favor of the bulls. At the same time, the RSI has bounced above the neutral threshold, which means that momentum is shifting back into positive territory and away from the oversold conditions seen earlier in the month.
For now, the mix of technical indicators seems to suggest a bullish outlook for the token ahead, with a potential breakout toward $50.
On the contrary, if bears manage to drag the token below the $40 support level, the bullish thesis would be invalidated and could lead to a steeper correction toward the $35 psychological floor.
Disclosure: This article does not represent investment advice. The content and materials featured on this page are for educational purposes only.